


Buffett’s OXY: Company Analysis
Legendary Investor Company Analysis

Why did legendary investor Warren Buffett buy so much OXY? Occidental Petroleum Corporation (OXY) has been in the news lately as one of Buffett's few acquisitions, as Buffett has been mostly moving to cash. As a result of his purchases of OXY, Buffett now owns 28% of OXY. So who is OXY and why did he buy it?

1 of 5 – Company Overview
Occidental Petroleum Corporation (OXY) is an oil company based in Texas. According to the latest Fortune 500 list, it is the 110th largest company in the US by revenue ($28 billion).

Overall, its business is similar to U.S. oil giants Exxon (XOM) and Chevron (CVX), but OXY is much smaller in terms of market capitalization. OXY is roughly 1/10th the size of Exxon (XOM) by market cap:
Exxon (XOM): $490 billion
Chevron (CVX): $287 billion
Occidental (OXY): $49 billion
While Exxon, Chevron and Occidental are all very large companies in their own right, it is important to put them in a global context. Globally, the US oil production per day accounts for only 12.9 million barrels per day, that is about 16% of the world's oil production. Significant, but not dominant. There are many non-US oil companies out there. More on that in the next chapter below.

When we talk about oil companies, they tend to look at their business in 3 parts: upstream, midstream and downstream. This sounds more complex than it is. Upstream is all about finding and extracting oil and gas. Midstream is the transportation, storage and processing of oil and gas. Downstream is the final part and includes turning oil and gas into final products such as diesel and gasoline and selling those products to consumers.
OXY is an integrated energy company, meaning that it operates in all 3 segments, but the vast majority of its revenues come from upstream activities. OXY has oil and gas exploration rights in the US and outside the US. 4 areas in the US and 4 areas outside the US (Algeria, Oman, Qatar, UAE).
OXY Location of Oil and Gas Exploration Rights in the US
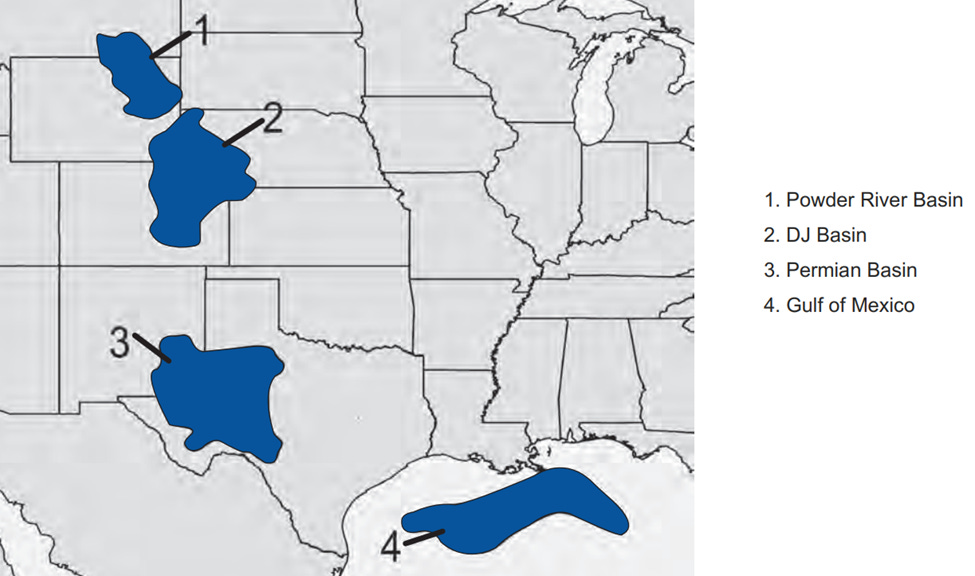
Source: https://www.oxy.com/siteassets/documents/investors/2023-annual-report.pdf
OXY Location of International Oil and Gas Exploration Rights
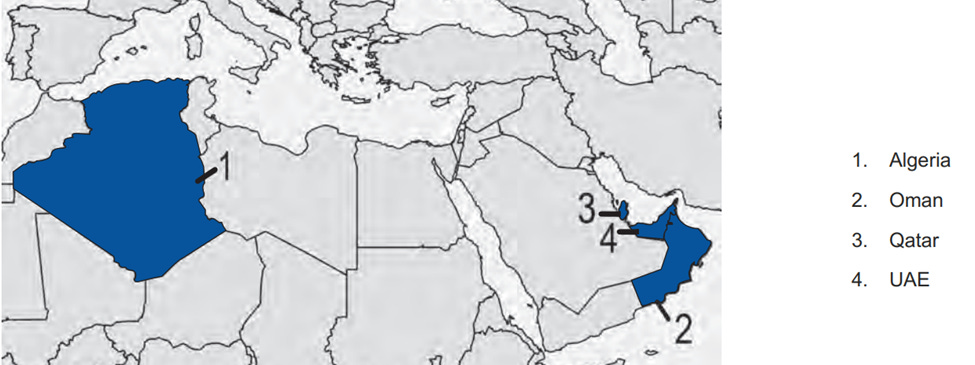
Source: https://www.oxy.com/siteassets/documents/investors/2023-annual-report.pdf
OXY Oil and Gas Reserves
If you are a US oil company, you are always looking for new oil and gas reserves. The oil and gas reserves you currently have will eventually run out and need to be replaced with new oil and gas reserves. This is a normal business challenge for US companies.
According to E&Y, the average reserves to extraction/production ratio for US oil and gas companies is about 9.82 years for oil and 11.43 years for natural gas. Source: https://www.ey.com/en_us/insights/oil-gas/oil-and-gas-industry-trends
This means that for example, an average U.S. oil company, based on its typical annual oil extraction/production rate, will deplete its oil reserves in 9.82 years if it does not acquire additional oil fields.
Each industry has its own metrics. In the oil and gas industry, one such important metric is barrels of oil equivalent (BOE). For an easier discussion about oil and gas, oil and gas are converted to barrels of oil equivalent (BOE). For example, approximately 6,000 cubic feet of natural gas has the energy equivalent of one barrel of oil. So if you sold 6,000 cubic feet of gas and one barrel of oil, you would have sold two BOE. Let’s take a look at OXY’s oil and gas reserves measured together, described in BOE.
As of December 31, 2023, Occidental's worldwide proved reserves totaled 4.0 billion barrels of oil equivalent (BOE) (https://www.oxy.com/siteassets/documents/investors/quarterly-earnings/oxy4q23earningspressrelease.pdf). At OXY’s current oil extraction/production rate of 1,223 thousand BOE per day (https://www.oxy.com/siteassets/documents/investors/2023-annual-report.pdf), this equates to an average annual production rate of 0.446 billion BOE. This in turn translates into reserves (reserves to extraction/production ratio) of about 8.97 years (4.0 / 0.446) for OXY, which is slightly below average for U.S. oil companies (the average is 9.82 as mentioned above). Not bad.
2 of 5 – Market Analysis
Oil & gas is a global industry. Oil is shipped around the world, while gas is more complex, often requiring pipeline transport or liquefaction for shipment as liquefied natural gas. US sanctions have complicated shipments from sanctioned countries such as Russia and Venezuela, but as a globally needed commodity, it finds its way to end users, albeit at inflated prices through various intermediaries.

Beyond the market disruptions associated with these sanctions, there are also environmental considerations. While many would like to see oil and gas replaced with renewable energy, the reality is that oil and gas remain relevant and are growing.
As the chart below shows, global energy consumption is growing, and whenever a new energy source appears, it is simply added to the existing energy sources without reducing older sources such as coal, oil, and gas. For better or worse, the importance of oil, gas, and coal in the global energy mix cannot be overstated - and barring something dramatic, it is likely to remain so.
The quote often attributed to Mark Twain, "The reports of my death are greatly exaggerated," applies very well to the global oil and gas industry. Please note that this is a description of reality, not a value statement for or against oil and gas.

Source: https://ourworldindata.org/energy-production-consumption
Except for periods of recessions, which temporarily reduce economic activity and thus reduce demand for all energy sources including oil and gas during the recession, the outlook for the industry remains cautiously optimistic.
US vs Other Oil Producers
While the U.S. is a significant oil producer, producing about 12 million barrels of oil per day, it only accounts for about 16% of global oil production. There are many non-US global oil companies.
The world's largest oil producer by market capitalization is Saudi Arabia's Saudi Aramco with a market capitalization of $1.8 trillion, about 4 times the size of Exxon. The combined production volume of all US oil companies exceeds that of Saudi Arabia, but given Saudi Arabia's massive oil reserves, that is likely a long-term profit maximization choice for Saudi Arabia. According to the Global Fortune 500, Saudi Arabia's Saudi Aramco is the 4th largest company in the world and one of the most profitable companies in the world. Saudi Aramco manages oil reserves in Saudi Arabia, which sits on one of the largest oil reserves in the world (see below the global map of oil reserves).
Unfortunately, its shares had been only traded on the Tadawul, the Saudi stock exchange. This had made it very difficult, if not impossible, for U.S. investors to buy Saudi Aramco stock. However, just a few months ago, in October 2024, the US broker Interactive Brokers announced that their clients can now buy shares in Saudi Arabia, including the oil giant Saudi Aramco, through their platform (https://financefeeds.com/interactive-brokers-becomes-the-first-global-broker-to-launch-saudi-equities/). Something to look into. But I digress.
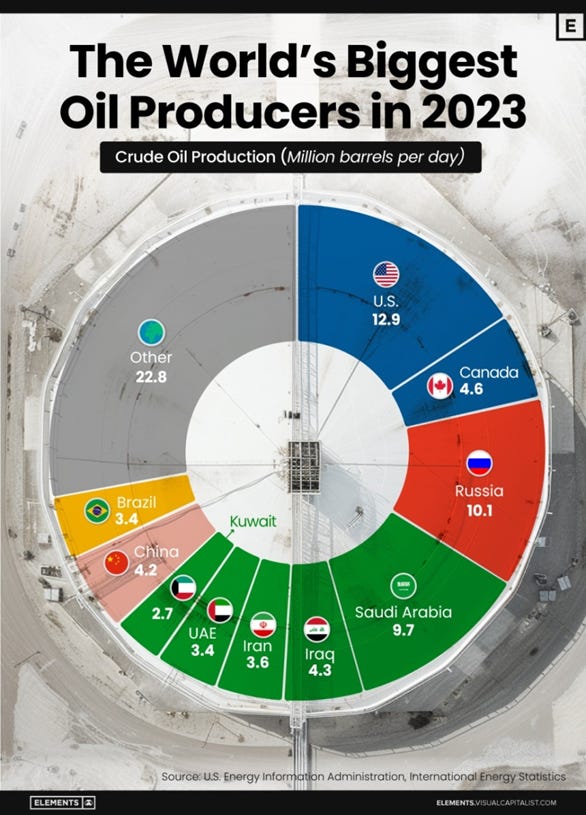
Source: https://elements.visualcapitalist.com/the-worlds-biggest-oil-producers-in-2023/
Oil and gas are not evenly distributed on our planet, as the map below from 2013 shows. Although the map is a bit older, it shows nicely the uneven global distribution of known oil reserves. For example, the large oil reserves in Saudi Arabia are managed by Saudi Aramco. As you can see, the countries with the largest oil reserves outside of the US and Canada - such as Venezuela, Iran, Iraq, Russia, Kuwait, UAE, and Saudi Arabia - tend to be in the news as countries of “interest” to other nations. For example, if you're wondering why the US is so interested in who's running Venezuela, but not its neighbor, the huge oil reserves may have something to do with it.
Location of Oil Reserves around the World (as of 2013)

Source: https://petroleumservicecompany.com/blog/what-are-the-worlds-largest-oil-reserves/
3 of 5 – Financial Performance
Occidental Petroleum Corporation (OXY), one of the leading oil and gas companies in the United States, has navigated through a tumultuous period in the energy sector from Fiscal Year (FY) 2019 to FY 2023.
Revenue & Net Income
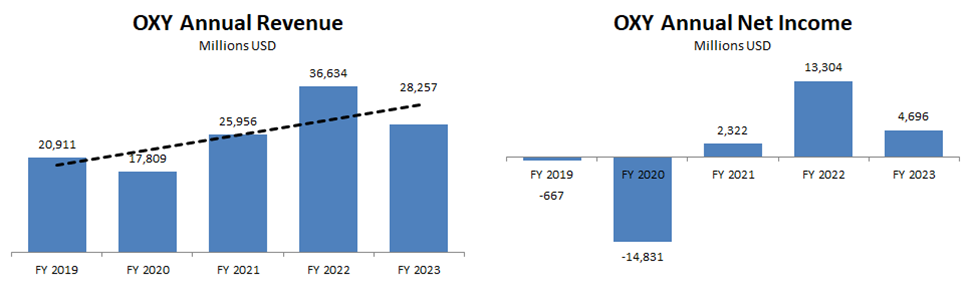
Data source: https://stockanalysis.com/stocks/oxy/
While revenue has fluctuated over the past 5 years, the overall trend line is up.
FY 2020 impacted OXY like almost all companies, and revenue fell to around $17.8 billion, and the company posted a net loss of $14.8 billion, primarily due to the impact of the COVID-related economic downturn on energy demand.
FY 2021 saw a significant recovery of OXY as the economy began to recover from the COVID-related economic downturn with soaring revenues ($25.9 billion) and a return to profitability (net income of $2.3 billion).
FY 2022 saw a big spike in oil prices (see chart below), leading to a great year for OXY with soaring revenue ($36.6 billion) and net income ($13.3 billion).
FY 2023 saw a return to normalcy, with revenue and net income still higher than any time since FY 2019, but lower than FY 2022 due to the decline in oil prices.
Oil Prices – Historical Chart (price per barrel)

Source: https://www.macrotrends.net/1369/crude-oil-price-history-chart
Revenue and net income look good. What about debt?
Debt
Let’s look at the company’s debt position. This is important because a very high debt ratio can mean the company is close to bankruptcy. On the other hand, a very low debt ratio might indicate that the company is not managing its resources effectively for its shareholders since debt financing is usually cheaper than equity financing (due to leverage). The whole topic of optimal capital structure (debt vs. equity) is a separate topic, and for anyone interested in that topic, you can search the topic online using the keyword “Capital Structure Theory.”
The best indicator for this is the Total Debt-to-Total Assets ratio, which is calculated by dividing total liabilities (the money the company owes), by total assets (what the company owns). For example, if the company has $60 in total liabilities and $100 in assets, the debt-to-asset ratio would be 60%.
What is a good Total Debt-to-Total Assets ratio?
According to Investopedia, “In general, a ratio around 0.3 (30%) to 0.6 (60%) is where many investors will feel comfortable,..”
Source: https://www.investopedia.com/terms/t/totaldebttototalassets.asp
So how did OXY do?

Data source: https://stockanalysis.com/stocks/oxy/
OXY has improved its debt position since FY2019. It experienced a COVID-related increase in its debt ratio in FY2020 but has since reduced its debt ratio to 59%, which is significantly lower than in FY2019 when it was 68%.
A debt ratio of 59% is not bad. That may limit the company's ability to take on a lot of new debt without further equity issuance. But having Warren Buffett on board, with a record $325 billion cash pile, should help with any capital needs.
Dividends
OXY currently has a dividend yield of about 1.69%. Not bad, but nothing to write home about. Here is OXY's recent dividend history. Exxon, an S&P Dividend Aristocrat company (read more about Dividend Aristocrats here), famously borrowed money during COVID to be able to pay dividends. OXY did not. Nothing wrong with that. Just a different shareholder management strategy.

Source: https://stockanalysis.com/stocks/oxy/dividend/
Let’s talk about the stock price and valuation.
4 of 5 – Valuation
OXY stock is currently trading at around $52, up from Warren Buffett's most recent purchase in December 2024 when OXY stock was around $45, but well below the historic high of nearly $120 in 2011. Anyone who bought OXY at around $10 during the COVID crisis in 2020 is now laughing all the way to the bank.
Occidental Petroleum Corporation (OXY)
NYSE: OXY, US dollar
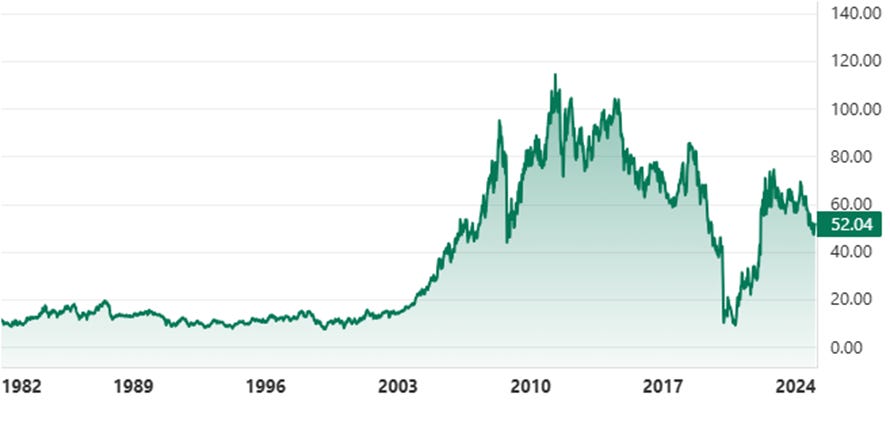
Source: https://stockanalysis.com/stocks/oxy/
Let's take a look at OXY stock from a price-to-earnings (P/E) ratio perspective. P/E ratios vary by industry, with high-growth technology companies typically having the highest P/E ratios and utilities having the lowest P/E ratios.
A good benchmark for OXY would be the Oil & Gas ETF XLE (The Energy Select Sector SPDR Fund - XLE). Its current P/E ratio is around 15.30. OXY's current P/E ratio is 13.6, which means it looks slightly undervalued compared to its benchmark XLE. While OXY is cheaper than the P/E benchmark (XLE) and well below its historical stock price high (nearly $120), on a pure P/E basis, OXY looks slightly undervalued but not a bargain. Warren Buffett, who now owns about 28% of OXY, must see some value beyond this slightly undervalued status of OXY.

Oil Companies as an Inflation Hedge
When inflation is a concern, as is now, investors look to commodities like gold, silver, and other commodities like oil and gas. And maybe, and this is pure conjecture, in addition to any guidance he can bring to OXY's management as a substantial shareholder (he owns 28%), Warren Buffett sees oil as an inflation hedge.
But, is it true that oil is an inflation hedge? Let's take a look at the average annual price of oil from 1950 to 2024.
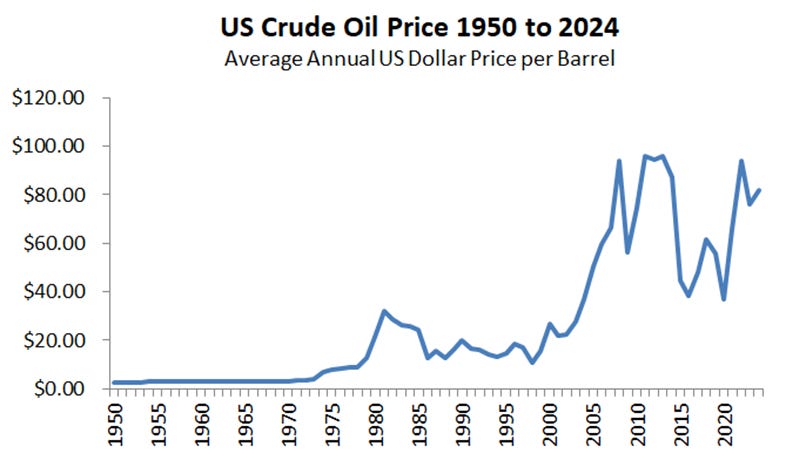
In 1950, a barrel of oil sold for $2.51. In 2024, that same barrel of oil sold for $82.00. There have been some ups and downs in between, such as due to the OPEC oil sanctions of 1979, which drove up oil prices in the West, and so on. But overall, there is a clear upward trend.

In 1950, a barrel of oil cost $2.51.
By 2024, that price had risen to $82.00, an increase of 32.7 times.
That is a lot. But let's peel that onion a little bit. Let's see if we can separate the inflationary effects from the other effects (mainly supply/demand). As we all know, prices go up over the years and things get more expensive due to inflation and other factors.
For example, take this McDonald's menu from the 1950s:
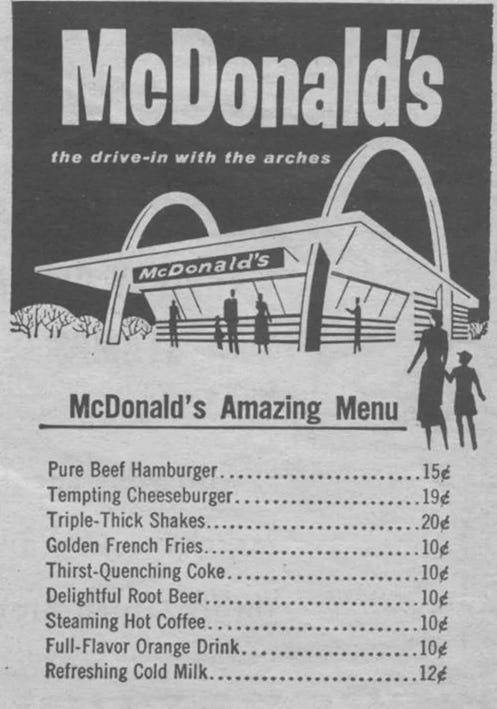
Source: https://www.mirror.co.uk/news/gallery/mcdonalds-menus-through-the-years-5696067
Then you could buy a hamburger for 15 cents. Currently the national US average for a McDonald’s hamburger is $2.54 (https://fastfoodmenuprices.com/how-much-mcdonalds-hamburger/), a significant increase.
This is not surprising when you look at the purchasing power of the US dollar over time:

Source: https://www.visualcapitalist.com/purchasing-power-of-the-u-s-dollar-over-time/
So let’s see how much of the oil price increase from 1950 to 2024 is due to inflation. There are many websites where you can do this, such as this one:
https://www.in2013dollars.com/us/inflation/1950?endYear=2024&amount=2.50
In any case, I used the official US government CPI number for this. I know there is a passionate discussion about the accuracy of the CPI as an indicator for inflation. Other sites like ShadowStats argue that the inflation is greater than as indicated by the CPI. But for the purpose of this article, I will stick with the official US government CPI numbers.
Again let's see if we can separate the inflationary effects from the other effects (mainly supply/demand).
$2.51 in 1950's dollars is the equivalent of $32.74 in 2024 dollars. This is the effect of inflation, the loss of purchasing power.
Applying this to the oil price comparison, we can separate the inflationary effects from the other effects (mainly supply/demand).

In 1950, a barrel of oil cost $2.51. That price was in 1950 dollars. Since then, the value of the dollar has fallen because of inflation.
Adjusted for inflation, the 1950 price would be about $32.74 in 2024 dollars. That is a 13-fold increase due to inflation.
Today, a barrel of oil sells for about $82.00. This increase from $32.74 to $82.00 is a 2.5-fold increase. This increase is due to non-inflationary factors, mostly due to changes in supply and demand.
This means that historically oil has been a good inflation hedge. The price has been turbo-charged by the deteriorating supply/demand balance since 1950.
What does all this mean?
If history repeats itself, and it looks like it will, oil prices should continue to rise in line with inflation, turbo-charged (as in the past) by a deteriorating supply/demand balance. Good for any investor in oil companies like OXY - an effective inflation hedge similar to gold and silver, with annual dividends while you wait.
5 of 5 – Summary
Occidental Petroleum Corporation (OXY) stands out as one of legendary investor Warren Buffett's few recent big buys as he builds his cash pile to historic highs (currently at around $325 billion). OXY is slightly undervalued on a P/E basis, and oil, like gold and silver, is a good inflation hedge.
As any investor knows, there are no certainties, only probabilities, but the probabilities look good for the oil sector.
For full disclosure, I do not currently own shares of Occidental Petroleum Corporation (OXY) but own other shares of US and non-US oil and gas companies. I am considering adding OXY to my portfolio.
Thank you for reading the article. Hope you enjoyed it.
Hungry for more? Subscribe to the newsletter - it's free and fabulous.Enjoyed this article? Don't keep it to yourself! Share it with a friend or two. It's free, and they might even buy you a coffee as a thank you.Your Fringe Finance
Disclaimer
Neither the author nor Fringe Finance is a financial advisor or a tax professional. This article is for illustrative and educational purposes only and does not constitute a specific offer of any product or service.
Past performance of stocks and assets is not an indicator or guarantee of future performance of stocks and assets.
The information in this blog does not constitute an offer to buy or sell, or a solicitation of an offer to buy or sell, any of the securities mentioned herein.
We believe the information provided is accurate and current. However, we do not guarantee its accuracy and it should not be considered a complete analysis of the topics discussed.
Any opinions expressed reflect the author's judgment at the time of publication and are subject to change.
Seek guidance from qualified financial and tax experts before taking action.
Buffet loaned money to Vicki to bail her out after the great coughing spell of 2020. Why? All those blue smudges on your map are also locations where his choo choo train goes to. Same with apple he bought something like 25,000 iPads for all their choo choo employees before that he buys apple stock. “Buffet” will be dead soon…that’s what people should really be analyzing. P.s. the guys I know in OG say the Permian and powder river basin is dried up.
Great article but disagree on wanting to have more renewables. LONG LIVE THE KING OIL!!!